Billionaire Israel Englander 1000X'd His Stake in a Vanguard ETF That's Been a Surefire Moneymaker, According to History Statistically, the index this exchange-traded fund (ETF) tracks has never declined over any rolling 20-year period, including dividends, since the start of the 20th century.
Achieve Robust Diversification With These 3 Equal-Weight ETFs Equal-weight ETFs like RSP, QQEW, and DFVE offer alternatives to market-cap-weighted funds, providing more balanced exposure across holdings with 2026 YTD returns near 12-13%.
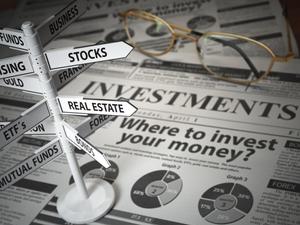
Avoid This Hidden Risk of Index Funds Investing in index funds is a good way to gain exposure to a broad range of stocks, but it's not without risk.
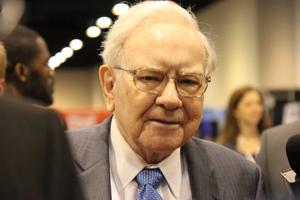
The Vanguard ETF Warren Buffett Endorsed in 2014 Would Have Turned $5,000 Into $20,465 Today The Oracle of Omaha understands that too many investors easily fall into the trap of trying to outperform the market, ultimately undermining their own performance.
Which S&P 500 ETF Is Better in 2026? State Street's SPY or iShares' IVV? IVV's 0.03% expense ratio and $886 billion in assets make it a compelling alternative for buy-and-hold investors seeking broad market exposure.
Buying VOO Near All-Time Highs Could Still Be a Smart Move You can't know the one thing you need to know about timing the market.
The Rise of Active ETFs: Can Fund Managers Outperform Passive Investing? Whether you want someone to oversee your ETF or prefer to go it alone, knowing what you can expect is important.
He Predicted the Dot-com Bubble Burst. Now He's Saying SpaceX Could be a Fresh Warning Sign. Jeremy Grantham famously called the Dot-com bubble's top, and he's increasingly worried about an AI bubble.
Don't Want Exposure to SpaceX? Why Investing in These Types of ETFs May Be the Way to Go Many funds will soon include SpaceX, and that can make them riskier and more volatile. But that doesn't include ones that track the S&P 500.
3 Charts That Could Change the Course of Summer Trading The S&P 500 faces a potential 20% correction in H2 2026 as VIX signals volatility, oil price risk threatens inflation, and rate hike odds rise to 80%.
Here's How Much a 1 Percentage Point Difference in Returns Could Cost Your Retirement Over 30 Years The difference between a robust retirement and one that's cutting it uncomfortably close is largely a matter of limiting the nickel-and-dime costs.
3 Emerging Long-Term Headwinds for the S&P 500 The endless bull market might slow down a bit more than most investors are expecting.
VOO vs. SPY: Which Popular S&P 500 ETF Is the Better Buy? Expense differences and fund structure can impact long-term returns for investors choosing between these two S&P 500 giants.