

Workplace furnishings manufacturer HNI Corporation (NYSE:HNI) reported revenue ahead of Wall Street’s expectations in Q2 CY2025, with sales up 7% year on year to $667.1 million. Its non-GAAP profit of $1.11 per share was 29.7% above analysts’ consensus estimates.
Is now the time to buy HNI? Find out by accessing our full research report, it’s free.
HNI (HNI) Q2 CY2025 Highlights:
- Revenue: $667.1 million vs analyst estimates of $646.5 million (7% year-on-year growth, 3.2% beat)
- Adjusted EPS: $1.11 vs analyst estimates of $0.86 (29.7% beat)
- Adjusted EBITDA: $103.8 million vs analyst estimates of $83.47 million (15.6% margin, 24.4% beat)
- Operating Margin: 10.2%, up from 8.9% in the same quarter last year
- Free Cash Flow Margin: 2.4%, down from 5.6% in the same quarter last year
- Market Capitalization: $2.44 billion
“Our second quarter revenue growth and profit improvement demonstrate the strength of our strategies and our ability to manage through varying macroeconomic conditions, while remaining focused on investing for the future. We expect strong results to continue, driven by our margin expansion efforts and continued volume growth,” stated Jeff Lorenger, Chairman, President, and Chief Executive Officer.
Company Overview
With roots dating back to 1944 and a significant acquisition of Kimball International in 2023, HNI (NYSE:HNI) manufactures and sells office furniture systems, seating, and storage solutions, as well as residential fireplaces and heating products.
Revenue Growth
A company’s long-term performance is an indicator of its overall quality. Any business can put up a good quarter or two, but the best consistently grow over the long haul.
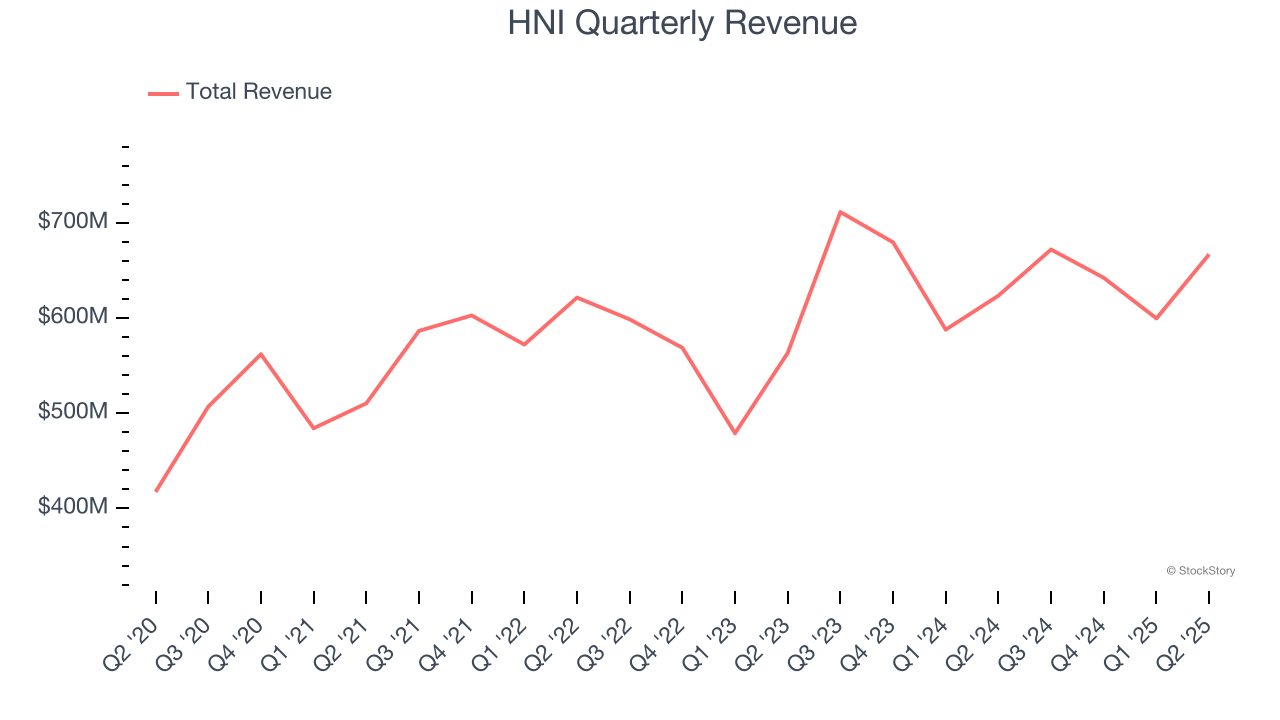
With $2.58 billion in revenue over the past 12 months, HNI is a mid-sized business services company, which sometimes brings disadvantages compared to larger competitors benefiting from better economies of scale.
As you can see below, HNI’s 4.9% annualized revenue growth over the last five years was mediocre. This shows it couldn’t generate demand in any major way and is a tough starting point for our analysis.
We at StockStory place the most emphasis on long-term growth, but within business services, a half-decade historical view may miss recent innovations or disruptive industry trends. HNI’s annualized revenue growth of 8.1% over the last two years is above its five-year trend, suggesting its demand recently accelerated. 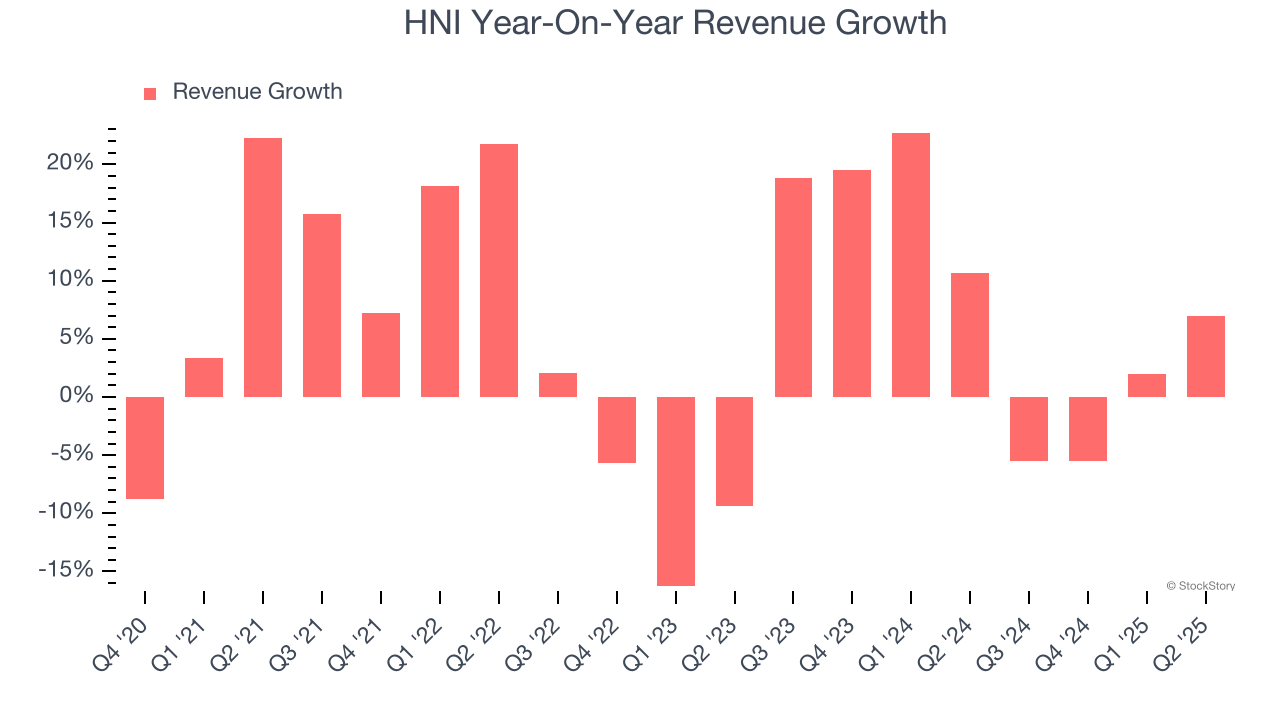
This quarter, HNI reported year-on-year revenue growth of 7%, and its $667.1 million of revenue exceeded Wall Street’s estimates by 3.2%.
Looking ahead, sell-side analysts expect revenue to grow 3.4% over the next 12 months, a deceleration versus the last two years. This projection doesn't excite us and implies its products and services will face some demand challenges.
Software is eating the world and there is virtually no industry left that has been untouched by it. That drives increasing demand for tools helping software developers do their jobs, whether it be monitoring critical cloud infrastructure, integrating audio and video functionality, or ensuring smooth content streaming. Click here to access a free report on our 3 favorite stocks to play this generational megatrend.
Operating Margin
Operating margin is an important measure of profitability as it shows the portion of revenue left after accounting for all core expenses – everything from the cost of goods sold to advertising and wages. It’s also useful for comparing profitability across companies with different levels of debt and tax rates because it excludes interest and taxes.
HNI was profitable over the last five years but held back by its large cost base. Its average operating margin of 6.8% was weak for a business services business.
On the plus side, HNI’s operating margin rose by 2.9 percentage points over the last five years, as its sales growth gave it operating leverage.
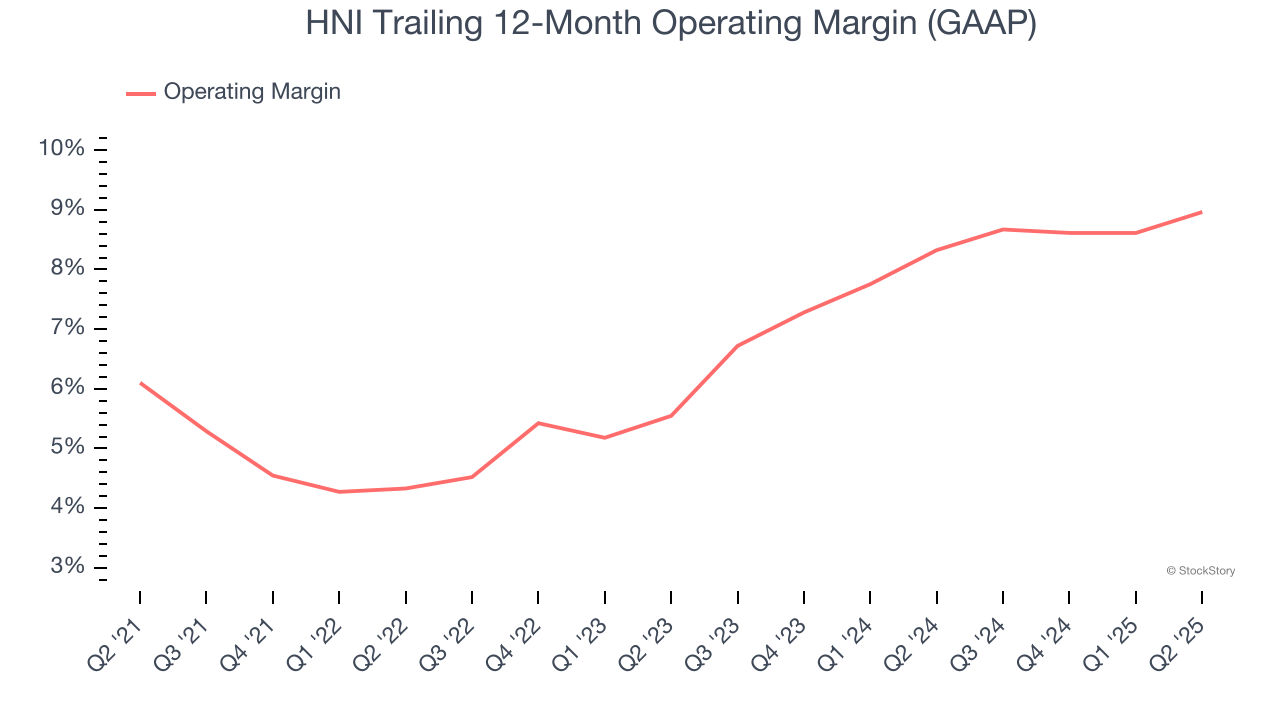
This quarter, HNI generated an operating margin profit margin of 10.2%, up 1.3 percentage points year on year. This increase was a welcome development and shows it was more efficient.
Earnings Per Share
We track the long-term change in earnings per share (EPS) for the same reason as long-term revenue growth. Compared to revenue, however, EPS highlights whether a company’s growth is profitable.
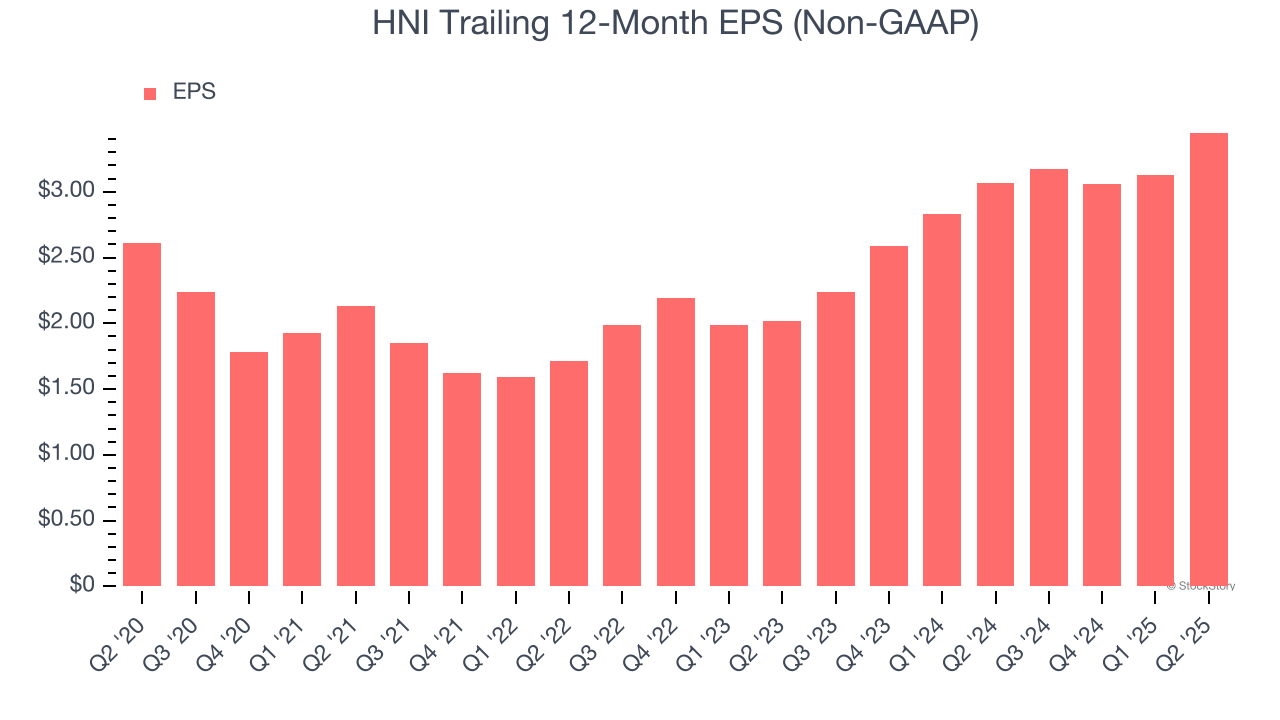
HNI’s unimpressive 5.7% annual EPS growth over the last five years aligns with its revenue performance. On the bright side, this tells us its incremental sales were profitable.
Like with revenue, we analyze EPS over a shorter period to see if we are missing a change in the business.
HNI’s two-year annual EPS growth of 30.7% was fantastic and topped its 8.1% two-year revenue growth.
Diving into HNI’s quality of earnings can give us a better understanding of its performance. HNI’s operating margin has expanded by 3.9 percentage points over the last two years. This was the most relevant factor (aside from the revenue impact) behind its higher earnings; interest expenses and taxes can also affect EPS but don’t tell us as much about a company’s fundamentals.
In Q2, HNI reported EPS at $1.11, up from $0.79 in the same quarter last year. This print easily cleared analysts’ estimates, and shareholders should be content with the results. Over the next 12 months, Wall Street expects HNI’s full-year EPS of $3.45 to grow 7.8%.
Key Takeaways from HNI’s Q2 Results
We were impressed by how significantly HNI blew past analysts’ EPS and EBITDA expectations this quarter. We were also glad its revenue outperformed Wall Street’s estimates. Zooming out, we think this was a solid print. The stock traded up 2.2% to $53.74 immediately following the results.
Indeed, HNI had a rock-solid quarterly earnings result, but is this stock a good investment here? We think that the latest quarter is only one piece of the longer-term business quality puzzle. Quality, when combined with valuation, can help determine if the stock is a buy. We cover that in our actionable full research report which you can read here, it’s free.