

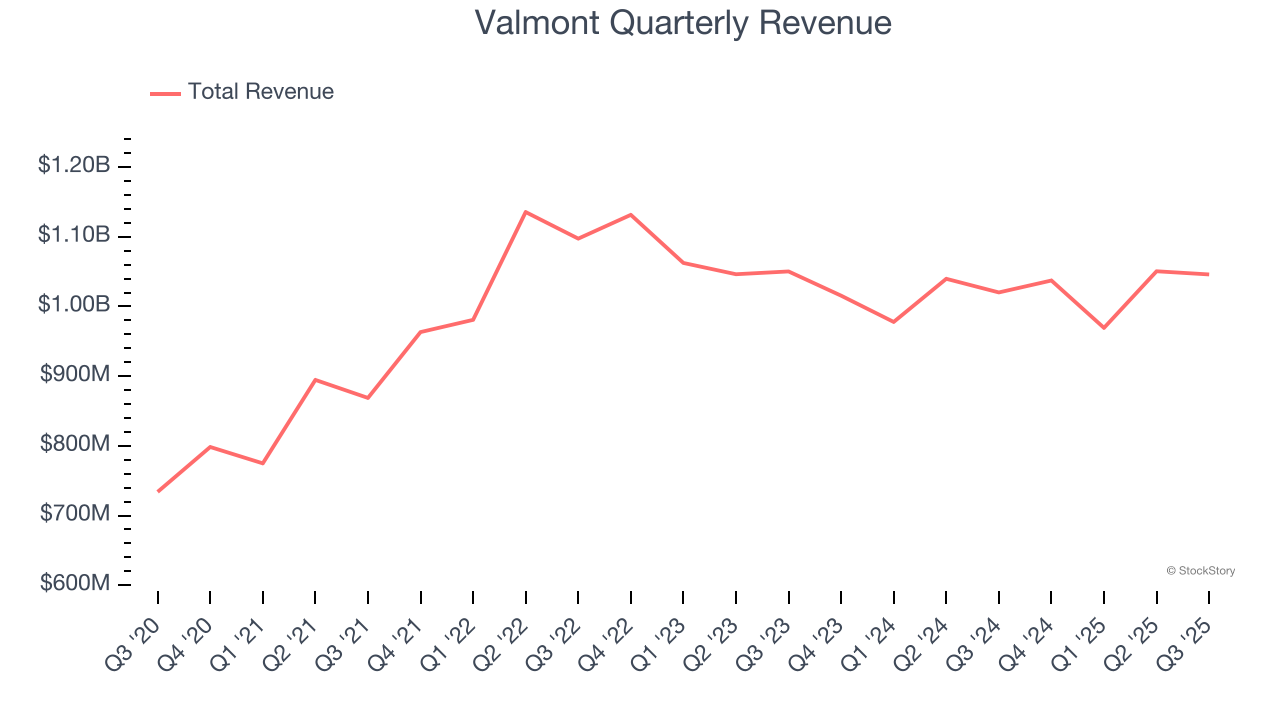
Infrastructure and agriculture equipment manufacturer Valmont Industries (NYSE:VMI) reported Q3 CY2025 results beating Wall Street’s revenue expectations, with sales up 2.5% year on year to $1.05 billion. The company expects the full year’s revenue to be around $4.1 billion, close to analysts’ estimates. Its non-GAAP profit of $4.98 per share was 7.8% above analysts’ consensus estimates.
Is now the time to buy Valmont? Find out by accessing our full research report, it’s free for active Edge members.
Valmont (VMI) Q3 CY2025 Highlights:
- Revenue: $1.05 billion vs analyst estimates of $1.03 billion (2.5% year-on-year growth, 1.5% beat)
- Adjusted EPS: $4.98 vs analyst estimates of $4.62 (7.8% beat)
- Adjusted EBITDA: $163.1 million vs analyst estimates of $161.2 million (15.6% margin, 1.2% beat)
- The company reconfirmed its revenue guidance for the full year of $4.1 billion at the midpoint
- Management raised its full-year Adjusted EPS guidance to $19.10 at the midpoint, a 6.1% increase
- Operating Margin: 13.5%, up from 12.3% in the same quarter last year
- Free Cash Flow Margin: 6.7%, down from 20.1% in the same quarter last year
- Backlog: $1.73 billion at quarter end
- Market Capitalization: $8.07 billion
President and Chief Executive Officer Avner M. Applbaum commented, “Our third quarter results reflect strong execution on our 2025 priorities and long-term value drivers. The Infrastructure segment delivered solid growth, led by robust Utility demand, improved factory throughput, and progress on our North American capacity expansions. While Agriculture markets remain challenged and our results reflect those conditions, our teams are executing with discipline and agility, positioning the business for long-term growth. Across Valmont, we’re channeling our efforts toward the areas of greatest opportunity – deploying resources where they create the most value, advancing innovation, and enhancing performance, while operating with greater clarity and speed. Given our results and the momentum across the organization, we’re raising our full-year earnings guidance. I’m proud of our team, whose dedication and culture of excellence continue to create lasting value.”
Company Overview
Credited with an invention in the 1950s that improved crop yields, Valmont (NYSE:VMI) provides engineered products and infrastructure services for the agricultural industry.
Revenue Growth
Examining a company’s long-term performance can provide clues about its quality. Any business can experience short-term success, but top-performing ones enjoy sustained growth for years. Thankfully, Valmont’s 8.1% annualized revenue growth over the last five years was decent. Its growth was slightly above the average industrials company and shows its offerings resonate with customers.
We at StockStory place the most emphasis on long-term growth, but within industrials, a half-decade historical view may miss cycles, industry trends, or a company capitalizing on catalysts such as a new contract win or a successful product line. Valmont’s recent performance marks a sharp pivot from its five-year trend as its revenue has shown annualized declines of 2.2% over the last two years. 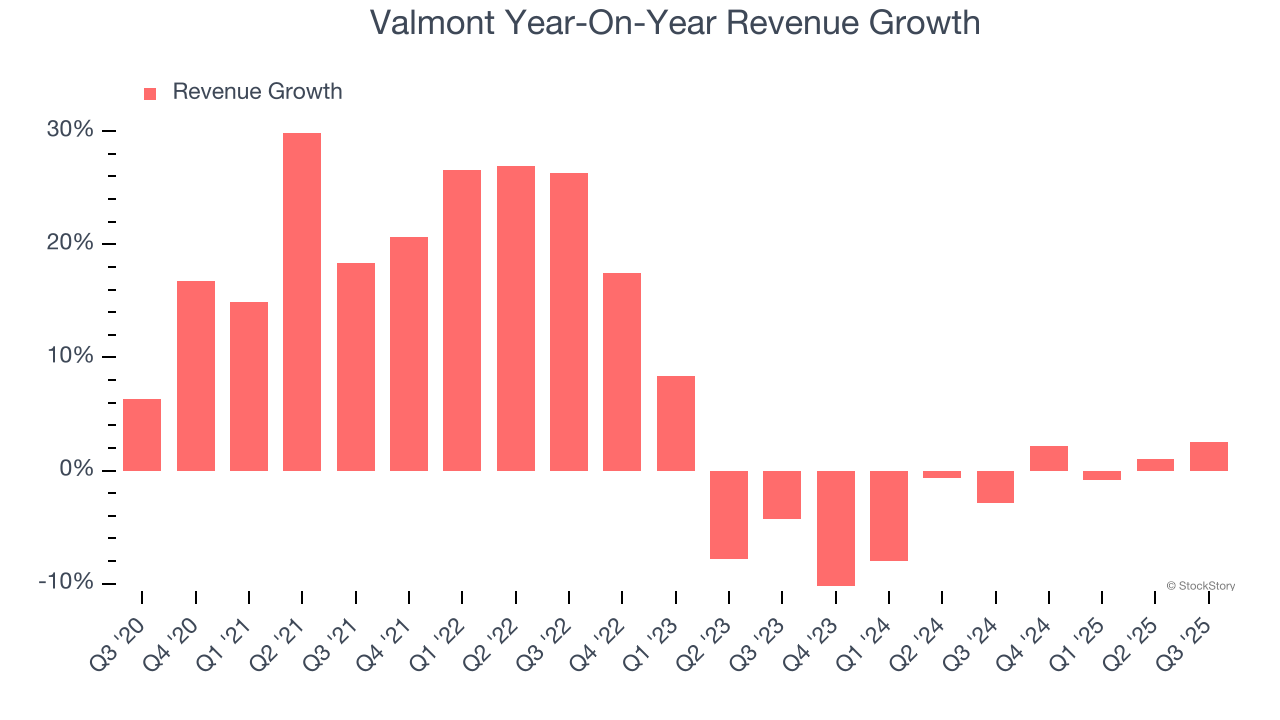
This quarter, Valmont reported modest year-on-year revenue growth of 2.5% but beat Wall Street’s estimates by 1.5%.
Looking ahead, sell-side analysts expect revenue to grow 3.1% over the next 12 months. While this projection indicates its newer products and services will catalyze better top-line performance, it is still below average for the sector.
Software is eating the world and there is virtually no industry left that has been untouched by it. That drives increasing demand for tools helping software developers do their jobs, whether it be monitoring critical cloud infrastructure, integrating audio and video functionality, or ensuring smooth content streaming. Click here to access a free report on our 3 favorite stocks to play this generational megatrend.
Operating Margin
Operating margin is an important measure of profitability as it shows the portion of revenue left after accounting for all core expenses – everything from the cost of goods sold to advertising and wages. It’s also useful for comparing profitability across companies with different levels of debt and tax rates because it excludes interest and taxes.
Valmont has done a decent job managing its cost base over the last five years. The company has produced an average operating margin of 9.5%, higher than the broader industrials sector.
Looking at the trend in its profitability, Valmont’s operating margin rose by 1.5 percentage points over the last five years, as its sales growth gave it operating leverage.
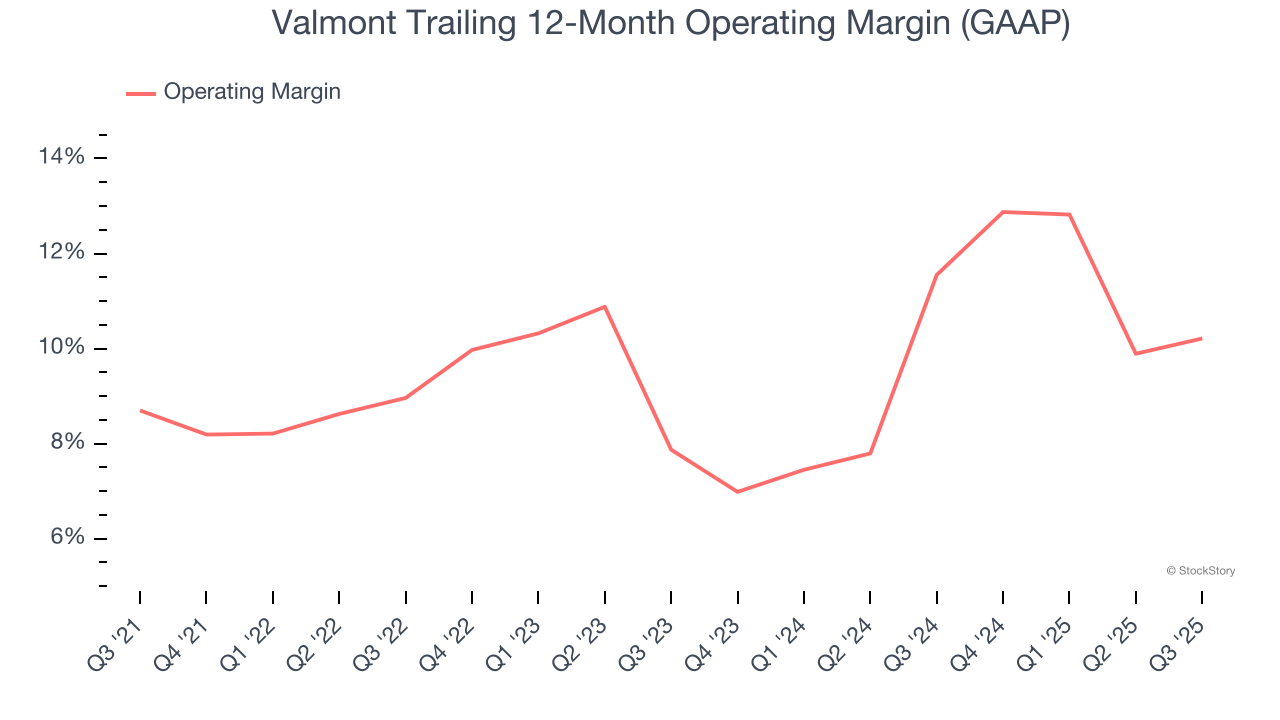
This quarter, Valmont generated an operating margin profit margin of 13.5%, up 1.2 percentage points year on year. The increase was encouraging, and because its operating margin rose more than its gross margin, we can infer it was more efficient with expenses such as marketing, R&D, and administrative overhead.
Earnings Per Share
Revenue trends explain a company’s historical growth, but the long-term change in earnings per share (EPS) points to the profitability of that growth – for example, a company could inflate its sales through excessive spending on advertising and promotions.
Valmont’s EPS grew at an astounding 18.7% compounded annual growth rate over the last five years, higher than its 8.1% annualized revenue growth. This tells us the company became more profitable on a per-share basis as it expanded.
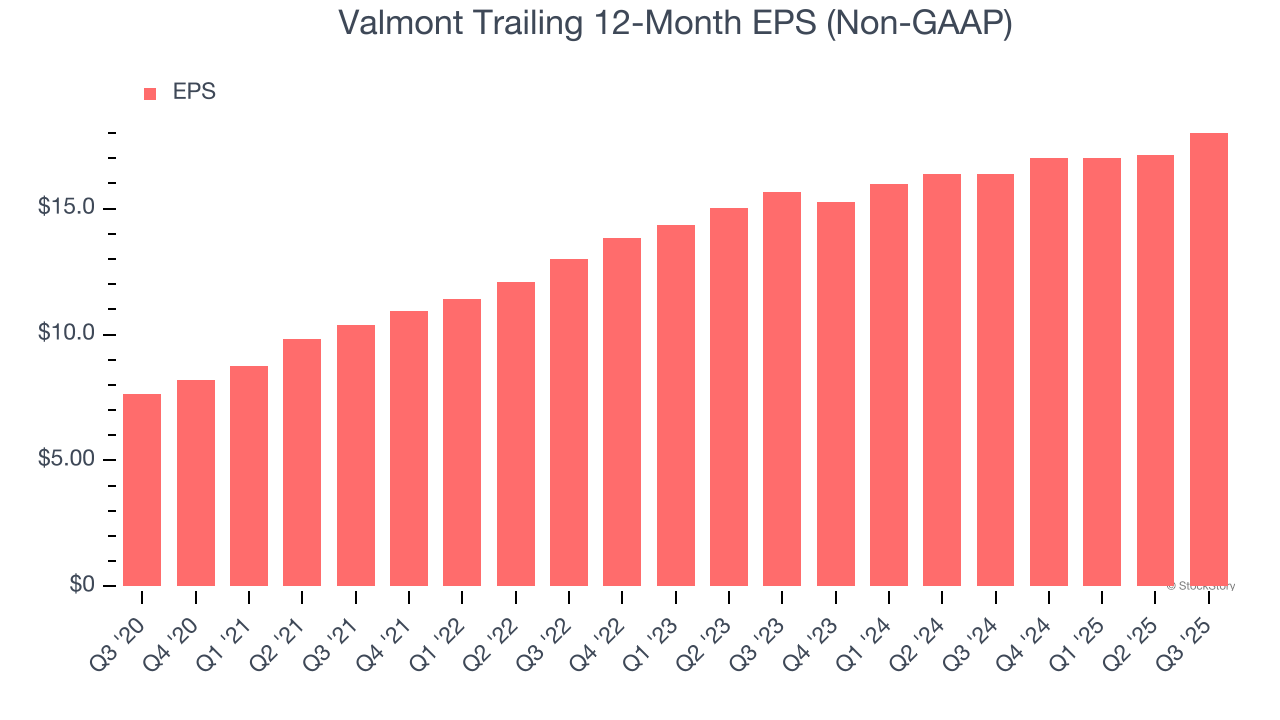
Diving into Valmont’s quality of earnings can give us a better understanding of its performance. As we mentioned earlier, Valmont’s operating margin expanded by 1.5 percentage points over the last five years. On top of that, its share count shrank by 7.2%. These are positive signs for shareholders because improving profitability and share buybacks turbocharge EPS growth relative to revenue growth. 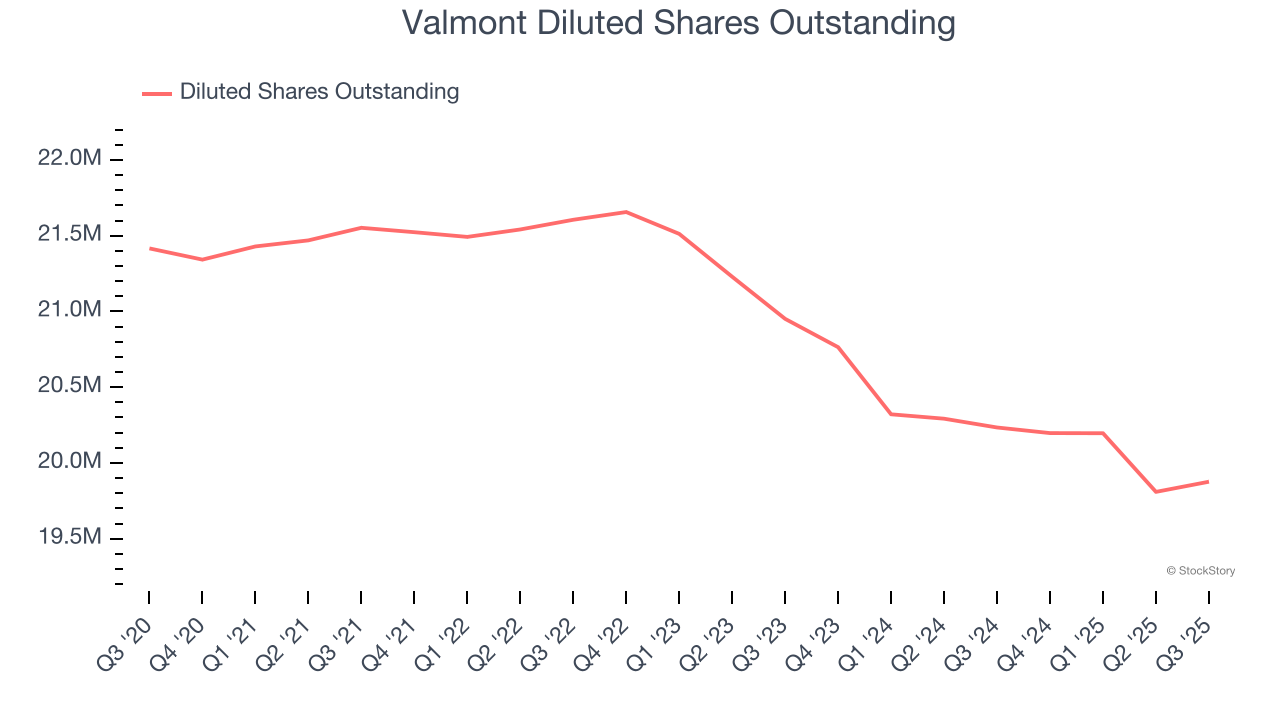
Like with revenue, we analyze EPS over a shorter period to see if we are missing a change in the business.
For Valmont, its two-year annual EPS growth of 7.2% was lower than its five-year trend. We hope its growth can accelerate in the future.
In Q3, Valmont reported adjusted EPS of $4.98, up from $4.11 in the same quarter last year. This print beat analysts’ estimates by 7.8%. We also like to analyze expected EPS growth based on Wall Street analysts’ consensus projections, but there is insufficient data.
Key Takeaways from Valmont’s Q3 Results
It was great to see Valmont’s full-year EPS guidance top analysts’ expectations. We were also happy its revenue narrowly outperformed Wall Street’s estimates. Overall, this print had some key positives. The stock traded up 1.4% to $414.14 immediately after reporting.
Sure, Valmont had a solid quarter, but if we look at the bigger picture, is this stock a buy? The latest quarter does matter, but not nearly as much as longer-term fundamentals and valuation, when deciding if the stock is a buy. We cover that in our actionable full research report which you can read here, it’s free for active Edge members.