
- Year-over-year price growth continues its downward trend, only rising 1.1% in October 2025.
- Price declines expanded from six of the 100 largest metros in January to 32 by October, marking the broadest softening of prices since the early 2010s.
- Metropolitan areas that saw the largest slowdown in home price growth over the past year include Miami and St. Petersburg, FL; Rochester, NY; Las Vegas, NV; Seattle ,WA; and Dallas, TX — all down six percentage points or more.
Cotality™, a leader in property information, analytics, and data-enabled solutions, released its Home Price Index™ for October 2025 data today.
This press release features multimedia. View the full release here: https://www.businesswire.com/news/home/20251204581855/en/
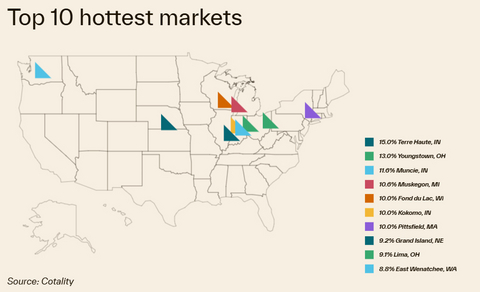
Top 10 hottest markets for home price growth in October 2025. Source: Cotality
Home prices grew 1.1% in October, continuing an ongoing downward trend in price increases. While the deceleration stands in contrast to the strong trajectory recorded at the beginning of the year, this deceleration reflects a much-needed rebalancing after years of unsustainable gains.
Despite only modest price increases, affordability constraints continue to push homeownership out of reach for many. Cotality experts found that this economic pressure has led to a 15% slowdown in out-of-state migration over the last five years, as high costs and uncertainty encourage people to stay put.
However, some areas of the country remain accessible to buyers.
Where is buying a house affordable1?
- Johnstown, PA
- Elmira, NY
- Joplin, MO
- Decatur, IL
- Weirton, WV
Regional differences remain pronounced, with demand favoring areas that offer both economic opportunity and relative affordability. Still, the trend toward softening prices is clear. Not since the early 2010s have prices softened so widely. Price declines expanded from six of the 100 largest metros in January to 32 by October.
This deceleration highlights the impact of higher mortgage rates earlier in the year and persistent affordability challenges. Furthermore, price growth was dampened by a notable increase in inventory. Many markets saw a surge in both existing and newly built homes, driven by a slowing rate of in-migration and weakened demand.
"Slowing price growth reflects a much-needed rebalancing after years of unsustainable gains. While some markets are experiencing declines, these adjustments will help restore affordability over time and make housing more accessible to a wider group of buyers,” said Cotality’s Chief Economist Dr. Selma Hepp.
The next Cotality Home Price Index will be released on January 6, 2026, featuring data for November 2025. For ongoing housing trends and data, visit the Cotality Insights blog: www.cotality.com/insights.
1: The most and least affordable U.S. cities were adjusted this month to reflect updated Listing Trends data.
Methodology
The Cotality HPI™ is built on industry-leading public record, servicing and securities real-estate databases and incorporates more than 45 years of repeat-sales transactions for analyzing home price trends. Generally released on the first Tuesday of each month with an average five-week lag, the Cotality HPI is designed to provide an early indication of home price trends by market segment and for the Single-Family Combined tier, representing the most comprehensive set of properties, including all sales for single-family attached and single-family detached properties. The indices are fully revised with each release and employ techniques to signal turning points sooner. The Cotality HPI provides measures for multiple market segments, referred to as tiers, based on property type, price, time between sales, loan type (conforming vs. non-conforming) and distressed sales. Broad national coverage is available from the national level down to ZIP Code, including non-disclosure states.
Cotality HPI Forecasts™ are based on a two-stage, error-correction econometric model that combines the equilibrium home price—as a function of real disposable income per capita—with short-run fluctuations caused by market momentum, mean-reversion, and exogenous economic shocks like changes in the unemployment rate. With a 30-year forecast horizon, Cotality HPI Forecasts project Cotality HPI levels for two tiers — Single-Family Combined (both attached and detached) and Single-Family Combined Excluding Distressed Sales. As a companion to the Cotality HPI Forecasts, Stress-Testing Scenarios align with Comprehensive Capital Analysis and Review (CCAR) national scenarios to project five years of home prices under baseline, adverse and severely adverse scenarios at state, metropolitan areas and ZIP Code levels. The forecast accuracy represents a 95% statistical confidence interval with a +/- 2% margin of error for the index.
About Market Risk Indicators
Market Risk Indicators are a subscription-based analytics solution that provide monthly updates on the overall health of housing markets across the country. Cotality data scientists combine world-class analytics with detailed economic and housing data to help determine the likelihood of a housing bubble burst in 392 major metros and all 50 states. Market Risk Indicators is a multi-phase regression model that provides a probability score (from 1 to 100) on the likelihood of two scenarios per metro: a >10% price reduction and a ≤ 10% price reduction. The higher the score, the higher the risk of a price reduction.
About the Market Condition Indicators
As part of the Cotality HPI and HPI Forecasts offerings, Market Condition Indicators are available for all metropolitan areas and identify individual markets as overvalued, at value or undervalued. These indicators are derived from the long-term fundamental values, which are a function of real disposable income per capita. Markets are labeled as overvalued if the current home price indexes exceed their long-term values by greater than 10% and undervalued where the long-term values exceed the index levels by greater than 10%.
Source: Cotality
The data provided are for use only by the primary recipient or the primary recipient's publication or broadcast. This data may not be resold, republished or licensed to any other source, including publications and sources owned by the primary recipient's parent company without prior written permission from Cotality. Any Cotality data used for publication or broadcast, in whole or in part, must be sourced as coming from Cotality, a data and analytics company. For use with broadcast or web content, the citation must directly accompany first reference of the data. If the data are illustrated with maps, charts, graphs or other visual elements, the Cotality logo must be included on screen or website. For questions, analysis or interpretation of the data, contact Carly Owens at newsmedia@Cotality.com. Data provided may not be modified without the prior written permission of Cotality. Do not use the data in any unlawful manner. The data are compiled from public records, contributory databases and proprietary analytics, and its accuracy is dependent upon these sources.
About Cotality
Cotality accelerates data, insights, and workflows across the property ecosystem to enable industry professionals to surpass their ambitions and impact society. With billions of real-time data signals across the life cycle of a property, we unearth hidden risks and transformative opportunities for agents, lenders, carriers, and innovators. Get to know us at www.cotality.com.
View source version on businesswire.com: https://www.businesswire.com/news/home/20251204581855/en/
"Slowing price growth reflects a much-needed rebalancing after years of unsustainable gains." -- Dr. Selma Hepp, Cotality's Chief Economist
Contacts
Media Contact
Carly Owens
Cotality
newsmedia@Cotality.com