
To truly operate with an edge, you must have some way of discovering structural arbitrage — finding the variance between the outcome the masses are expecting and the outcome that is most likely to materialize. If a favorable variance exists relative to your hypothesis, you engage the opportunity (presuming that the delta is of significant girth). Otherwise, there’s no rational reason to take the risk.
So, why am I focusing on Box Inc (BOX)? It just so happens that the security is flashing a quantitative signal that carries near-term bullish implications. Under the principles and inferences of heteroskedasticity, we can measure the likely forward pathways of BOX stock based on past analogs. Such information will give us an edge over other traders.
Almost certainly, everyone else in the retail investment market will scour through Box’s third-quarter earnings report. What’s more, they’ll take forward projections of key financial metrics, adjust the underlying ratio relative to the share price and assign an updated intrinsic value of the company. The problem with this approach is that the market is non-ergodic, effectively meaning that the forecasted average return may be far different from the realized return.
Stated differently, even if you were to assign a reasonable price forecast on BOX stock, the projection would collapse all the middle variables — stochasticity, reflexivity, heteroskedasticity, etc. — leading up to that price point. Just an unexpected bout of volatility alone could disrupt expectations of compounding, as merely one example of the market’s non-linear cruelty.
Besides, if trading was such an easy discipline, people who read English and can perform middle-school math — basically every single American — would be expert traders. But that’s obviously not the case, in part because the market is incredibly complex.
Therefore, if you were interested in trading BOX stock (or any other security), you must have an advanced methodology. And that’s where trinitarian geometry comes into play.
Trading BOX Stock by Deciphering the Shape of Risk
To be a successful trader requires some intel regarding where BOX stock is going to end up at a given point in time. Obviously, no one has a crystal ball that can precisely call what price a security may reach. However, what we can do is break apart price action into multiple trials or sequences. By running multiple trials — similar to a Monte Carlo simulation — we can better determine where prices tend to coagulate.
Fundamentally, the trinitarian geometry that I developed combines three disciplines: probability theory (Kolmogorov), behavioral state transitions (Markov) and calculus (kernel density estimation or KDE). The central purpose of this approach is to identify and analyze probability density, the point where price clustering is the most prominent.
After all, if we know where prices tend to cluster, that gives us a non-parametric probability — not the hocus pocus probability derived from the Black-Scholes formula that everyone and their hamster uses. Even better, borrowing again from the inferences of heteroskedasticity, we can measure probability variances under different stimuli. That’s where we find structural arbitrage.
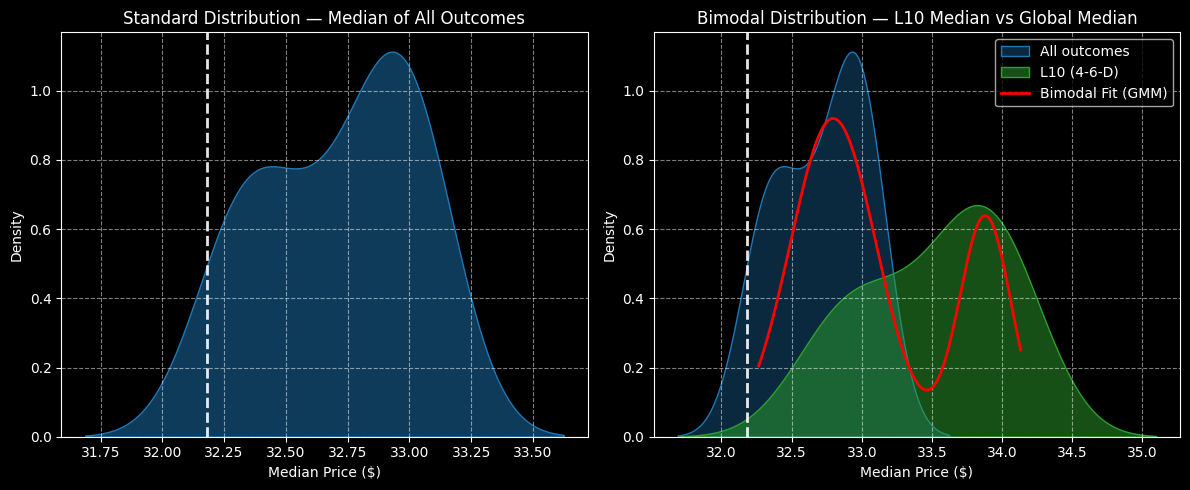
Using trinitarian geometry across 10-week trials, the forward 10-week returns of BOX stock can be arranged as a distributional curve, with outcomes ranging between roughly $31.70 and $33.65 (assuming an anchor price of $32.18, Wednesday’s close). Further, price clustering would likely be predominant at $32.90.
The above assessment aggregates all trials since January 2019. However, we’re interested in a specific signal, the 4-6-D sequence; that is, in the trailing 10 weeks, BOX stock printed four up weeks and six down weeks, with an overall downward slope.
Under this setup, forward returns would likely range between $31.70 and $35.20, with price clustering likely to materialize at around $33.80. As such, there’s a 2.73% positive variance between the two clusters — a potential structural arbitrage that could be expanded via the leverage of a multi-leg options strategy.
But this is also where circumstances take a very interesting turn.
You’ve Been Taught Wrong
From financial publication websites to major institutions, everybody defines the bull call spread the same way — it’s essentially a mechanism to buy a discounted net long position. While that’s true, it’s also a juvenile, Mickey Mouse definition. In reality, a bull spread is a mechanism by which we purchase distributional reality and sell distributional fantasy.
I suppose the technical term for a vertical (bull) spread is exploiting distributional mispricing. It can be considered a form of geometric arbitrage.
You see, we just used calculus and advanced probabilistic disciplines to solidify (or reify) the shape of risk. What’s fascinating with the bull spread geometry is that it allows us to effectively buy the future contract value that is most likely to materialize. At the same time, we sell the portion of the distribution that is less likely to materialize.
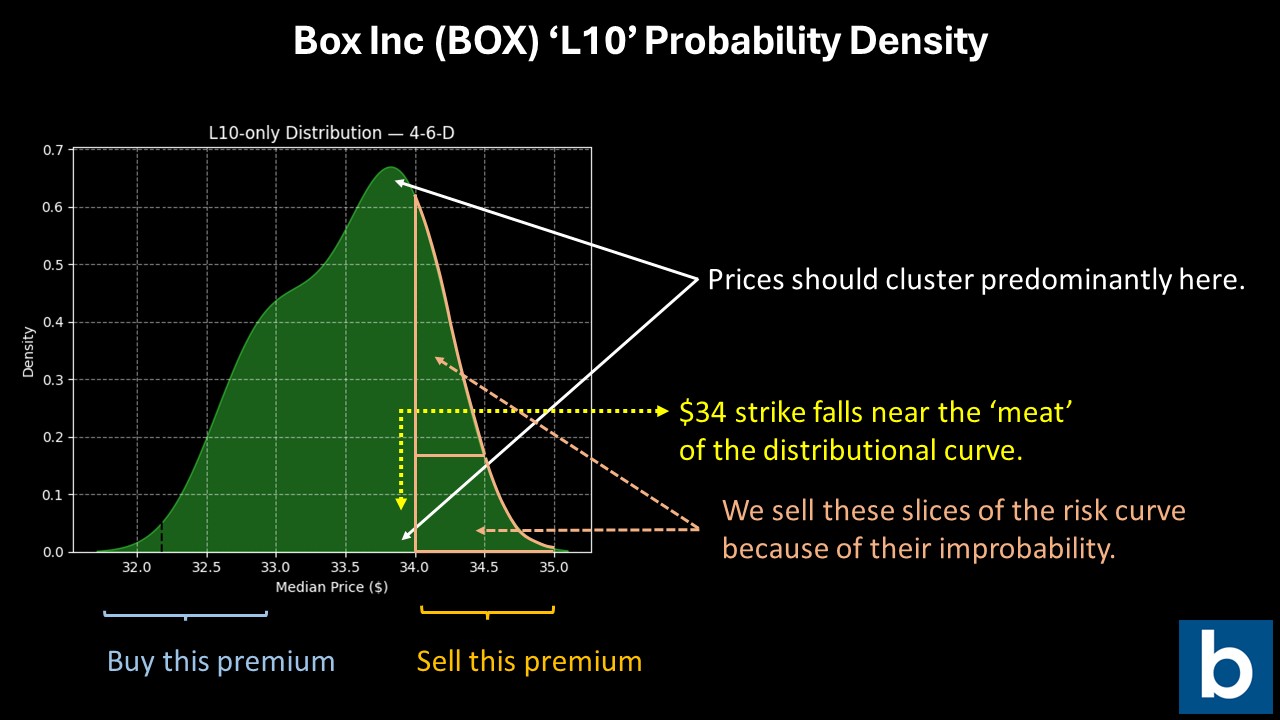
Given the intel, arguably the most enticing trade is the 32/34 bull call spread expiring Jan. 16, 2026. This trade is looking for BOX stock to rise through $34 at expiration, which would generate a maximum payout of 110.53%. Breakeven comes in at a contextually realistic $32.95.
Now, the reason for the calculus is that the drop-off in probability density occurs at a non-linear, exponential rate. Just between $34 and $34.50, density drops by nearly 71%. As rational actors, it behooves us to sell this portion of the premium, as the negative shift in risk curvature is catastrophically severe.
Of course, the cynical beauty here is that no one else knows about this drop-off. They’re either doing fundamental analysis — which is basically middle-school math on assumed (read fake) numbers — or technical analysis, which rarely involves math and a whole lot of imagination (and perhaps consumption of mind-altering substances).
As you can clearly recognize, understanding the shape of risk changes everything. It raises the obvious question: if this is real science — real analysis — then what have we been reading all this time until now?
On the date of publication, Josh Enomoto did not have (either directly or indirectly) positions in any of the securities mentioned in this article. All information and data in this article is solely for informational purposes. For more information please view the Barchart Disclosure Policy here.
More news from Barchart
- Box Inc’s (BOX) Probability Density Just Shifted—Uncovering a 110% Structural Arbitrage Trade
- Options Action: Naked Put Trade Ideas for December 3rd
- Is the Wheel the Best Options Strategy for Income? Here’s How to Trade Options Like Warren Buffett
- Netflix Stock Breaks Below 20-Day Moving Average Amid Selloff. Should You Buy the Dip?