
When markets sell off or momentum shifts, everyone wants the same question answered: “Are we bullish or bearish right now?”
In this clip from our latest Market on Close livestream, co-host “Twitter Tom” posed that exact question to Senior Market Strategist John Rowland, CMT — and John delivered a point-by-point breakdown of which indicators are giving us important clues right now.
The truth? The sky isn’t falling, and corrections are healthy. But the short-term trend has changed — and traders need to understand what that means.
Let’s break down the key signals John highlighted, what they mean for the market, and how to track them using Barchart tools.
Corrections Aren’t Crashes. They’re Opportunities.
Before turning to the indicators, John makes one important point:
Corrections allow investors to buy assets cheaper.
Nothing breaks a long-term uptrend faster than panic-driven headlines, but volatility is normal. That’s particularly true when index performance is concentrated in a handful of mega-cap stocks.
The bigger question then becomes whether the recent selling is:
- A normal pullback, or
- The start of a new downtrend
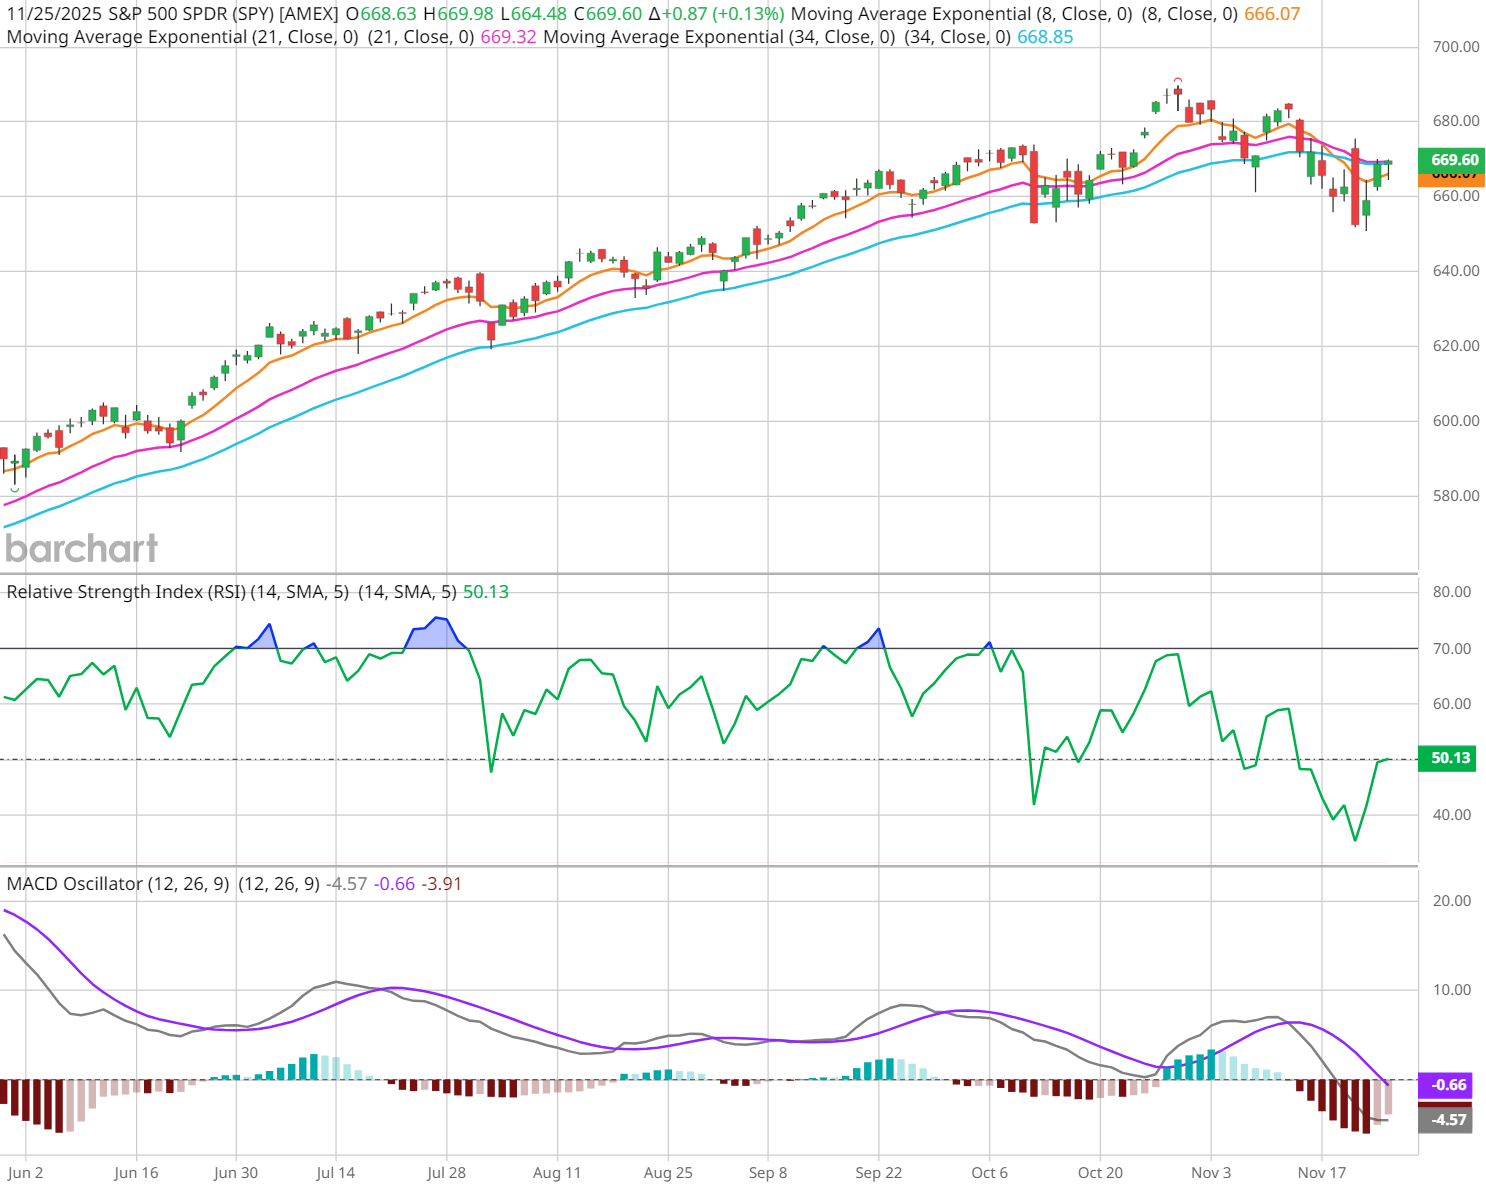
To answer that, John looks at price structure, Relative Strength Index (RSI), the MACD Oscillator, and exponential moving averages (EMAs).
Signal #1: Short-Term Trend Has Turned Bearish
John’s first chart shows the 8, 21, and 34 EMAs — his preferred indicators for identifying trend structure.
Here’s what he sees:
- Multiple bearish EMA crossovers
- Sloping EMAs pointing downward
- Price closing below short-term averages
This confirms one thing: Short-term momentum is bearish. But that’s not the whole story.
Signal #2: The RSI Just Flipped Out of Bullish Mode
RSI tells us how buyers vs. sellers are behaving inside the trend.
In bull markets:
- RSI usually stays above 50
- RSI rarely dips below 40
But John’s chart shows not only an RSI break below 50, it’s also revealing a deeper dip beneath 40.
This signals that the prior uptrend may have ended.
John points out something critical:
If we get a bounce, the big test will be whether RSI can reclaim 60. If it can’t, that’s classic bearish RSI behavior.
Signal #3: MACD Confirms Momentum Weakness
MACD gives deeper insight into momentum shifts.
In a bull market, a drop from above zero is usually just a correction.
But when MACD crosses below zero? That’s a confirmation of a new bearish trend.
According to John, the MACD has now crossed below zero. That means momentum is officially negative, so the downtrend may not be over yet.
This doesn’t mean a crash is playing out, but it does mean caution is recommended.
So… Bullish or Bearish?
John’s answer is balanced, and based on these technical indicator takeaways:
- Long-term trend (weekly charts): still intact
- Short-term trend (daily charts): bearish
- RSI + MACD: red flags are signaling more downside is possible
In other words, these signs suggest we’re still bullish long-term, and cautiously bearish short-term – leaving the outlook neutral overall until indicators reset.
That’s how professionals read the market.
How Traders Should Think Right Now
John’s framework keeps things simple:
- If RSI stays below 50 → the rally is weak
- If MACD stays below zero → momentum favors sellers
- If EMAs remain stacked bearishly → short-term trend remains down
But until weekly trends break, long-term investors should stay patient — not panicked.
How to Monitor These Signals on Barchart
For extra clarity, John likes to add Barchart’s proprietary Trend Seeker to the mix here: “It combines multiple time frames with momentum and volatility to provide a quick snapshot, but a precise reading of what to expect in trend analysis.”
You can follow every indicator John uses inside Barchart’s tools:
Using Interactive Charts:
- Add EMAs (8, 21, 34)
- Add RSI (look for the 40–60 shifts)
- Add MACD and watch for zero-line crosses
- Add Trend Seeker® for automated trend detection
Watch this quick clip to see John break down the signals in 90 seconds:
- Watch the Full Market on Close Episode for deeper analysis + market context
- Customize Barchart’s Chart Templates with RSI, MACD, EMAs and Trend Seeker
On the date of publication, Barchart Insights did not have (either directly or indirectly) positions in any of the securities mentioned in this article. All information and data in this article is solely for informational purposes. For more information please view the Barchart Disclosure Policy here.
More news from Barchart
- Watch These 3 Chart Indicators for Early Warning Signs That the Bull Market is Over
- JEPI, the Covered Call ETF That Started a Mania, Is a Fallen Star. Here’s What Comes Next.
- Find Breakout Stocks & Winning Option Trades with Our TTM Squeeze Lesson for Beginners
- The QQQ ETF Points to What’s Next for Stocks… And You Probably Won’t Like the Answer